Introduction
When shopping for a down jacket, terms like fill power, fill content, and fill weight often appear in product descriptions. Yet, many consumers — even experienced outdoor enthusiasts — are unclear about what these parameters truly mean and how they impact warmth, comfort, and durability.
In a competitive global apparel market valued at USD 1.5 billion for insulated jackets in 2024 (Statista), understanding these specifications is vital not only for consumers but also for manufacturers who aim to create high-quality, efficient, and cost-effective products.
This article breaks down the difference between down fill content and fill weight, supported by industry research and comparative data, to help you understand how to evaluate or design the best-performing down garments.
Understanding Down Fill Content
Definition
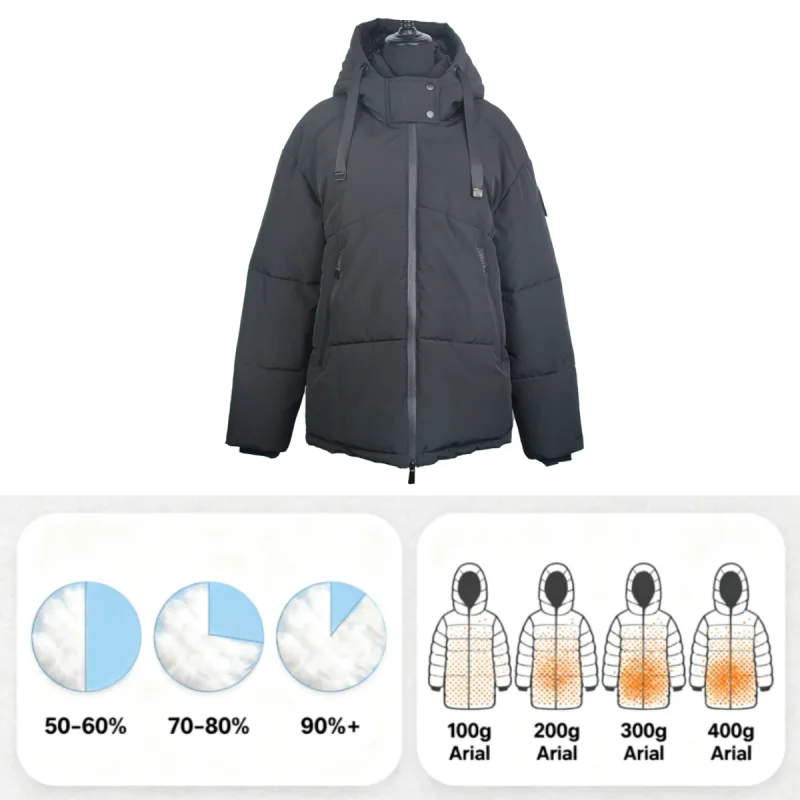
Down fill content refers to the percentage of down clusters compared to feathers or other materials in the filling of a jacket. For instance, a label reading “80/20 down-to-feather ratio” means the insulation contains 80% pure down clusters and 20% feathers.
Down clusters — the soft, fluffy plumules beneath the outer feathers of geese or ducks — are responsible for trapping air and providing insulation. The higher the percentage of down, the warmer and lighter the jacket tends to be.
Typical Down Ratios in the Market
| Down-to-Feather Ratio | Classification | Common Application | Relative Warmth | Typical Price Range (USD/pc) |
|---|---|---|---|---|
| 50/50 | Entry-level | Casual jackets | Low | $40–$70 |
| 70/30 | Mid-range | Urban outerwear | Medium | $80–$120 |
| 80/20 | Premium | Light performance | High | $120–$180 |
| 90/10 | High-end | Technical outdoor | Very High | $180–$300+ |
According to data from the International Down and Feather Bureau (IDFB, 2023), the 80/20 and 90/10 blends are the most commonly used in outdoor performance wear due to their superior warmth-to-weight ratio and compressibility.
To understand the differences between duck down and goose down, please see: Duck Down vs Goose Down Jackets: Which One Should You Choose?
Understanding Down Fill Weight
Definition
Fill weight measures how much down (by mass) is used in the jacket, typically expressed in grams or ounces. It indicates the total volume of insulation, not its quality.
While fill content focuses on purity, fill weight determines quantity — a crucial factor in how warm the jacket feels in cold environments.
Example Comparison:
| Jacket Model | Fill Power | Fill Content | Fill Weight | Approx. Temperature Rating | Intended Use |
|---|---|---|---|---|---|
| Jacket A | 600 | 70/30 | 150g | +5°C to -5°C | Everyday wear |
| Jacket B | 700 | 80/20 | 200g | -5°C to -15°C | Winter commute |
| Jacket C | 800 | 90/10 | 250g | -15°C to -25°C | Alpine trekking |
From this table, you can see that higher fill weight contributes to greater warmth, but it also increases bulk and weight — meaning a trade-off between mobility and insulation.
The Interplay Between Fill Content and Fill Weight
Both parameters must be balanced for optimal performance.
High fill content (90/10) provides maximum insulation efficiency per gram of filling.
Higher fill weight (more grams) enhances warmth but can reduce packability.
Low fill content (50/50) requires more fill weight to reach the same warmth level, increasing jacket weight and cost.
Warmth Efficiency Index (Illustrative Data)
| Fill Content | Fill Power | Fill Weight (g) | Warmth Index (Relative Scale 1–10) | Weight Efficiency (Warmth per 100g) |
|---|---|---|---|---|
| 50/50 | 550 | 250 | 5 | 2.0 |
| 70/30 | 650 | 200 | 6 | 3.0 |
| 80/20 | 700 | 180 | 8 | 4.4 |
| 90/10 | 800 | 150 | 10 | 6.7 |
Insight: Jackets with higher down purity require less fill to achieve similar warmth — offering better performance in lightweight designs.
Fill Power vs. Fill Content vs. Fill Weight — Key Differences
These three terms often confuse buyers. Here’s a clear breakdown:
| Parameter | Definition | Affects | Typical Range | Key Influence |
|---|---|---|---|---|
| Fill Power | Loft or fluffiness of down (measured in cubic inches per ounce) | Warmth-to-weight ratio | 400–900 | Quality of down clusters |
| Fill Content | Ratio of down to feather in insulation | Purity, insulation efficiency | 50/50–95/5 | Material composition |
| Fill Weight | Total mass of down used in jacket | Warmth, weight | 100–300g (typical) | Quantity of insulation |
Example:
A 700 fill power, 90/10, 180g jacket can be warmer and lighter than a 550 fill power, 70/30, 250g one — even though the latter contains more down by weight.
Real-World Research: Down Performance vs. Synthetic Alternatives
According to a 2023 study by the Outdoor Industry Association, down insulation continues to outperform synthetic materials in warmth-to-weight ratio by up to 50%, though synthetics fare better in wet conditions.
| Insulation Type | Warmth-to-Weight Ratio | Water Resistance | Compressibility | Lifespan (Years) |
|---|---|---|---|---|
| Natural Down (80/20) | Excellent | Moderate | High | 8–10 |
| Synthetic Fiber (Polyfill) | Good | Excellent | Medium | 5–7 |
| Recycled Down | Very Good | Moderate | High | 6–9 |
Key takeaway: For manufacturers, balancing fill content and fill weight with the intended use scenario (urban, alpine, or humid environments) helps ensure performance, sustainability, and consumer satisfaction.
Global Down Jacket Market Trends
Recent data from Grand View Research (2024) shows that the global down jacket market is expected to grow at a CAGR of 5.2% through 2030, driven by increasing demand for lightweight, thermal-efficient apparel.
Market Breakdown by Fill Type
| Region | Dominant Fill Ratio | Average Jacket Weight | Market Share (2024) | Growth Trend |
|---|---|---|---|---|
| North America | 80/20 Goose Down | 200g | 28% | Stable |
| Europe | 90/10 Duck Down | 180g | 25% | Increasing |
| Asia-Pacific | 70/30 Mixed Down | 220g | 32% | Rapid |
| Rest of World | 50/50 Blend | 240g | 15% | Moderate |
This data highlights that higher fill content and lighter designs are increasingly favored in premium markets, while cost-efficient blends remain common in mass production.
Manufacturing Insights: Achieving Optimal Balance
For garment manufacturers, optimizing fill content and fill weight involves:
Material sourcing: Use high-quality certified down (e.g., RDS-certified goose down).
Design balance: Align down weight with intended temperature rating and jacket category.
Testing standards: Follow international benchmarks like IDFB or EN 13537 for thermal insulation.
Cost optimization: Adjust blend ratios for market segmentation — e.g., 70/30 for mid-range, 90/10 for premium lines.
Manufacturing Example
A brand targeting the European winterwear market may choose:
Fill content: 85/15 goose down
Fill weight: 180–220g
Shell fabric: 20D nylon with DWR
Temperature rating: -10°C
This combination ensures lightweight performance and market competitiveness without overproduction cost.
Practical Buying Guide for Consumers
When selecting a down jacket, consider these practical points:
Cold climate? Choose higher fill content (85–90%) and fill weight (200–250g).
Mild winter or urban use? Opt for 70–80% down content and 120–180g fill weight.
Outdoor sports? Focus on higher fill power (700+) for warmth and compressibility.
Budget-conscious? 60–70% down with 200g fill weight offers good value.
Consumer Satisfaction Data (Outdoor Gear Lab, 2024)
| Fill Power | Avg. Customer Satisfaction (1–5) | Common Feedback |
|---|---|---|
| 500–600 | 3.8 | Good warmth but heavy |
| 650–750 | 4.4 | Balanced performance |
| 800+ | 4.8 | Excellent warmth and comfort |
View related products:
Unisex heavy waterproof windproof warmest winter coats on sale for cold weather with hood
Heavy long custom winter jacket with logo outdoor warmest womens puff jacket with hood
OEM Quilting lightweight puffer jacket for mens
Conclusion
Understanding down fill content and fill weight is essential for both consumers and manufacturers. Together, they determine a jacket’s warmth, comfort, packability, and overall performance.
Fill content = quality (purity of insulation).
Fill weight = quantity (amount of insulation).
Balancing both ensures that the final garment meets target warmth ratings without unnecessary bulk or cost.
For manufacturers, the right combination optimizes material usage, energy efficiency, and brand reputation in a competitive global market.
About JIANGSU OVERSEAS FAREAST INDUSTRIAL CO., LTD.
Founded in 2016, JIANGSU OVERSEAS FAREAST INDUSTRIAL CO., LTD. is a subsidiary of JIANGSU OVERSEAS GROUP CO., LTD. (JOC Group) — a trusted name in international textile and garment production.
With a design center, sample center, and R&D center in China, and factories across Myanmar, Vietnam, and Cambodia, the company combines innovation, capacity, and quality.
Production Scale: Over 10 garment production lines, producing 80,000+ pieces per month.
Certifications: BSCI and WRAP compliant.
Global Workforce: Over 4,000 employees worldwide.
Annual Output: Approximately 10 million garments.
Committed to “integrity, quality, efficiency, and win-win”, we provide high-quality, stylish, and functionally advanced apparel for international markets including Europe, the USA, and Australia.
If you are seeking a reliable partner for high-performance down jackets and garment manufacturing, we welcome you to collaborate with us.
Contact JIANGSU OVERSEAS FAREAST INDUSTRIAL CO., LTD. today and join our global network of satisfied clients.
